A Long Walk In The Park: Observations On The Behavior Of Horizontal Position As Resolved By Dissimilar GPS Receivers Under Similar Conditions
D. A. Whinery
November 27, 2004
Abstract
In order to determine the importance and effectiveness of WAAS as an enhancement to GPS, two consumer grade GPS receivers, one WAAS enabled and one non-WAAS enabled, were used to simultaneously track position on a 12.7 mile course. The resulting track records, as well as periodic correlated fixes at National Geodetic Survey benchmarks along the course were compared to draw conclusions about the comparative precision and accuracy of the two receivers. Given the nature of Magellan GPS receiver recorded track data, it was determined that the form of this experiment was not optimal to produce the desired result, and that if the experimenter is crazy enough, he may perform another experiment, recording NMEA output from each receiver. Elevation data was recorded, but is not addressed in this analysis.
Background
GPS, or the Global Positioning System enables a relatively inexpensive satellite receiver to determine and display its position on the surface of the earth. GPS was originally deployed and used by the U.S. military, and as such was offered to consumer and commercial users at a reduced accuracy, through a mechanism called Selective Availability or SA, until May 1, 2000. The elimination of SA allowed consumer units to offer increased accuracy such that a typical, well-chosen position solution was likely to be within 10 meters of the actual WGS84 position, rather than the 100 meter accuracy observed under SA. The error in position solutions degraded by SA was pseudo-random, evenly dispersed about the true position, and roughly periodic, so that the geometric center of SA-tainted fixes collected over a 58-minute period was relatively accurate.
WAAS, or the Wide Area Augmentation System, sends estimates of GPS system errors, as introduced by atmospheric issues, satellite orbit errors, and clock drift, to two geosynchronous satellites in position over the equator in the western hemisphere. The WAAS system was developed and deployed by the U.S. Department of Transportation and the Federal Aviation Administration, to improve the accuracy of GPS positions for use in aircraft flight approaches. A WAAS enabled GPS receiver can consistently provide position solutions that are accurate to 1 meter, given relatively wide exposure to the sky.
In order to produce its most accurate position information, a GPS receiver must receive signals from at least 4 GPS satellites, which are widely separated in the sky, as well as at least one WAAS satellite.
Instruments and Methodology
Two Magellan brand GPS receivers were used to collect data.
Model GPS 315, Firmware Version 3.14, released 2000
Magellan began producing the GPS 315 in 1998. At that time WAAS was unavailable, and Selective Availability was operational. The effects of SA on the design of the statistical filter through which the displayed position is passed are probably somewhat detrimental to the momentary accuracy of the displayed position.
Model Meridian Color, Version 4.02, released 2002
I thought I had updated the firmware in my Meridian Color, but now that I look at it, it was most likely the other one that the semi ran over that I updated. Magellan introduced the Meridian Series in 2001, with color street maps, an external antenna connector, and WAAS. Since the Meridian Color, even with this ancient firmware, never knew SA, it probably has a somewhat less damped displayed position filter.

Figure 1: The "Marsupial" GPS Receiver Carriage Arrangement
Methodology
The two GPS receivers were cleared of all track and waypoint information, and then allowed to acquire and correlate signals from the GPS satellites on the street in front of my apartment. Once they were both providing solutions, they were placed in a waist pack, where they stayed for most of the 12.7 mile course, over a total of 4 hours. The course included 3 laps around Ala Moana Park and Kewalo Marina, and provided a wide sky view and access to 3 National Geodetic Survey markers, which were fixed with each receiver each time the markers were passed. The 4 hour duration of the experiment included a stop at Ala Moana Shopping Center for root beer and popcorn, and should not be used to determine the average speed of travel.
Track information from the 2 receivers was exported to a personal computer, and preliminary analysis showed that the format of stored track information on Magellan GPS receivers (maybe others) was not particularly conducive to a comparative analysis. The way that both receivers reduce the data continually, to efficiently use available memory, and the fact that the choice of samples is related to changed in course, rather than a fixed time period, made a significant amount of interpolation necessary prior to analysis. Since the sample times were likely to be out of sync between the two receivers anyways, I had thought a lot about this during the 4 hours.
In the end, a program was written in Perl to break the tracks into individual vectors, each of which represented up to 5 minutes of travel, and then a position was interpolated for each second. Because one receiver synced faster at the beginning, the total time available for comparison was 3:37:41, or 13,061 seconds.
A better way to collect data would be to record the NMEA serial output from each receiver. NMEA reports once every two seconds when a solution is available, and includes much information not available through the user interface, such as satellites in view, satellites in use, signal levels, and dilution-of-precision (DOP) calculations.
Figure 2: Map Plot of the track recorded by the GPS 315
Figure 3: Map Plot of the track recorded by the Meridian Color
Reference Marks
In order to provide an absolute error estimate, GPS fixes were taken at three NGS marks in the area of Ala Moana Park. One 1 minute average was taken at each mark on each lap, for a total of 9 fixes. Information about the three marks used is on the three following pages.
See http://www.ngs.noaa.gov/
for more information on the National Geodetic Survey and to find information on
cataloged survey marks.
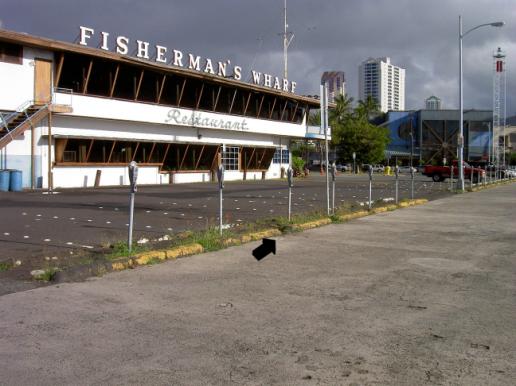
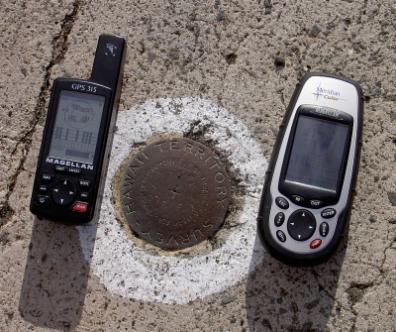
Figure 4: NGS Mark KEWALO (TU1277)
NAD 83(1993)- 21 17 38.32106(N) 157 51 28.59067(W) ADJUSTED
LOCAL TIDAL - 2. (meters)
HORZ ORDER - THIRD
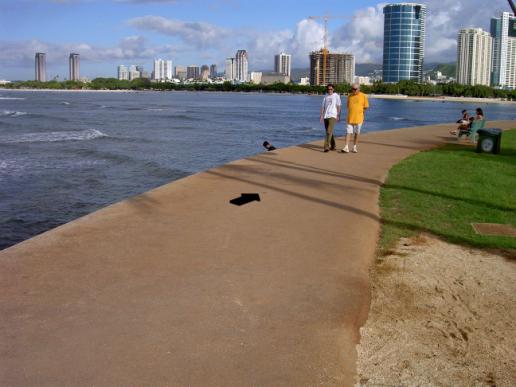
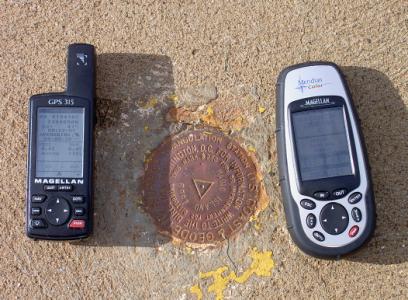
Figure 5: NGS MAGIC ISLAND (TU1256)
NAD 83(1993)- 21 17 03.56131(N) 157 50 53.93728(W) ADJUSTED LOCAL TIDAL - 3.8 (meters) HORZ ORDER - FIRST
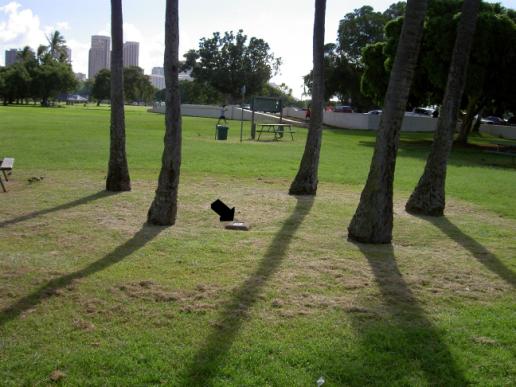
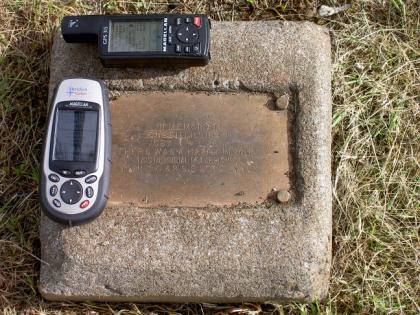
Figure 6: NGS Mark LILLIHAU 1961 (TU1257)
NAD 83(1993)- 21 17 24.88495(N) 157 50 55.93435(W) ADJUSTED LOCAL TIDAL - 1. (meters)HORZ ORDER - SECOND
Some
Data, Represented
Figure 7
shows the distance between the two GPS receiver’s track positions, in meters.
The difference was obtained by treating per-second WGS84 Universal Transverse
Mercator (UTM) positions, from the track vector interpolations, as simple
Cartesian coordinates.
Figure 7: Position Differential Between 2 GPS Receivers
The above graph’s most notable feature, the high linear ramp to the right, appears to have been caused by one receiver losing a usable solution while the other continued to record positions. The track logs show that the Meridian, which tends to be more sensitive, produced three track points during the period 20:24 to 20:48, whereas the GPS315 produced none during that time. As a result, the track vector being interpolated at that point was a static “last known position” on the GPS 315, while it was still updating on the Meridian. At the time where the ramp appears on the graph, I was approaching Ala Moana Shopping Center, and walking under the parking deck to the Makai Market food court. A look at the GPS satellite position model at:
http://sirius.chinalake.navy.mil/satpred/satpred_query.cgi
shows that there were 4 satellites within 16 degrees of the southern horizon, so that it is plausible that the Meridian actually synced and correlated position solutions, with fairly bad accuracy, given the deplorable precision offered by satellites so close together in the sky.
The workaday portion of the graph shows excursions of up to 100 meters. While it would be tempting to place blame on the older, cheaper, non-WAAS receiver, the comparison is inconclusive in placing blame. Figure 8 shows the signed velocity difference between the two tracks, with positive numbers representing a higher velocity reported by the GPS315, and negative numbers representing a higher velocity from the Meridian.
Figure 8: Velocity Difference between Tracks
Figure 9: Graph Of Satellite Visibility and Max. HDOP
The above graph provides a view of the attainable accuracy based on the visible satellites in the sky during the experiment. The (top) blue line shows the number of satellites 10 degrees or more above the horizon, the pink (middle) line is the number of satellites visible from Ala Moana Park, after subtracting those in the northern sky, which is obscured by mountains and tall buildings, and the yellow (bottom) line is the estimated maximum Horizontal Dilution Of Precision (HDOP), attainable at any point in time, given a clear view of the best possible satellites. Overall, the HDOP was relatively low, which indicates that the positions obtained were relatively accurate, compared to fixes obtained with higher HDOP.
Benchmark Position Comparisons
Table 1 shows the current NGS position data for the three marks used.
|
Mark Name |
Easting |
Northing |
Elevation |
|
|
KEWALO |
618,464.60 |
2,355,112.36 |
15.93 |
(Geoidal) |
|
MAGIC |
619,470.99 |
2,354,050.82 |
20.05 |
(Ellipsoidal) |
|
LILLIHAU |
619,408.65 |
2,354,706.07 |
15.93 |
(Geoidal) |
Table 1
Elevation data is included as a curiosity, since two of the NGS datasheets only supply height above geoid, and GPS measures height above ellipsoid. In considering elevation data, it’s also useful to know that the fixes were taken without regard for elevation, while I was squatting, holding the GPS receivers over my head.
Table 2 & 3 compare the fixes taken at each NGS mark with the datasheet positions.
|
|
Meridian |
|
|
|
|
|
Mark Name |
Easting |
Northing |
Pos.
Error |
Elevation |
Elev.
Error |
|
KEWALO3 |
618469 |
2355115 |
5.13 |
14 |
1.93 |
|
KEWALO1 |
618464 |
2355115 |
2.71 |
18 |
2.07 |
|
KEWALO2 |
618462 |
2355115 |
3.70 |
18 |
2.07 |
|
LILIHAU3 |
619407 |
2354708 |
2.55 |
19 |
3.07 |
|
LILIHAU2 |
619406 |
2354707 |
2.81 |
18 |
2.07 |
|
LILIHAU1 |
619404 |
2354705 |
4.77 |
13 |
2.93 |
|
MAGIC1 |
619471 |
2354058 |
7.18 |
14 |
6.05 |
|
MAGIC3 |
619474 |
2354056 |
5.99 |
18 |
2.05 |
|
MAGIC2 |
619471 |
2354054 |
3.18 |
15 |
5.05 |
|
Averages |
|
|
4.22 |
meters |
3.03 |
Table 2
|
|
GPS315 |
|
|
|
|
|
Mark Name |
Easting |
Northing |
Pos.
Error |
Elevation |
Elev.
Error |
|
KEWALO3 |
618465 |
2355113 |
0.76 |
14 |
1.93 |
|
KEWALO1 |
618467 |
2355113 |
2.48 |
18 |
2.07 |
|
KEWALO2 |
618465 |
2355115 |
2.67 |
18 |
2.07 |
|
LILIHAU3 |
619406 |
2354714 |
8.37 |
15 |
0.93 |
|
LILIHAU2 |
619409 |
2354707 |
1.00 |
21 |
5.07 |
|
LILIHAU1 |
619406 |
2354707 |
2.81 |
13 |
2.93 |
|
MAGIC1 |
619467 |
2354052 |
4.16 |
15 |
5.05 |
|
MAGIC3 |
619473 |
2354058 |
7.45 |
17 |
3.05 |
|
MAGIC2 |
619469 |
2354058 |
7.45 |
17 |
3.05 |
|
Averages |
|
|
4.13 |
|
2.91 |
Table 3
Oddly enough, the GPS 315 won the benchmark competition, although only by 11 centimeters.
Conclusions
The only semi-conclusive result, is to say that for locations with a relatively wide sky view, and situations involving relatively low velocities, the non-WAAS GPS 315 didn’t perform so poorly that it was useless. The spike in figure 7 shows that the Meridian receiver’s sensitivity made it possible to continue solving for position under the Ala Moana Parking deck. It is probable (pure, somewhat educated speculation) that the sensitivity difference also contributed to the 100 meter errors in the Figure 7.
The results of the benchmark tests seem to indicate that a 1-minute average fix with a lot of sky over it can compete pretty well with a WAAS fix. It would be interesting to do the extended experiment and collect all NMEA output, so that the individual solutions, the satellites used, and the computed DOP values could be considered.
It seems probable that the WAAS receiver would have showed smaller errors for moving, instantaneous fixes, and that in arbitrary situations and sky views, (like those ones that life provides), WAAS would win out.